
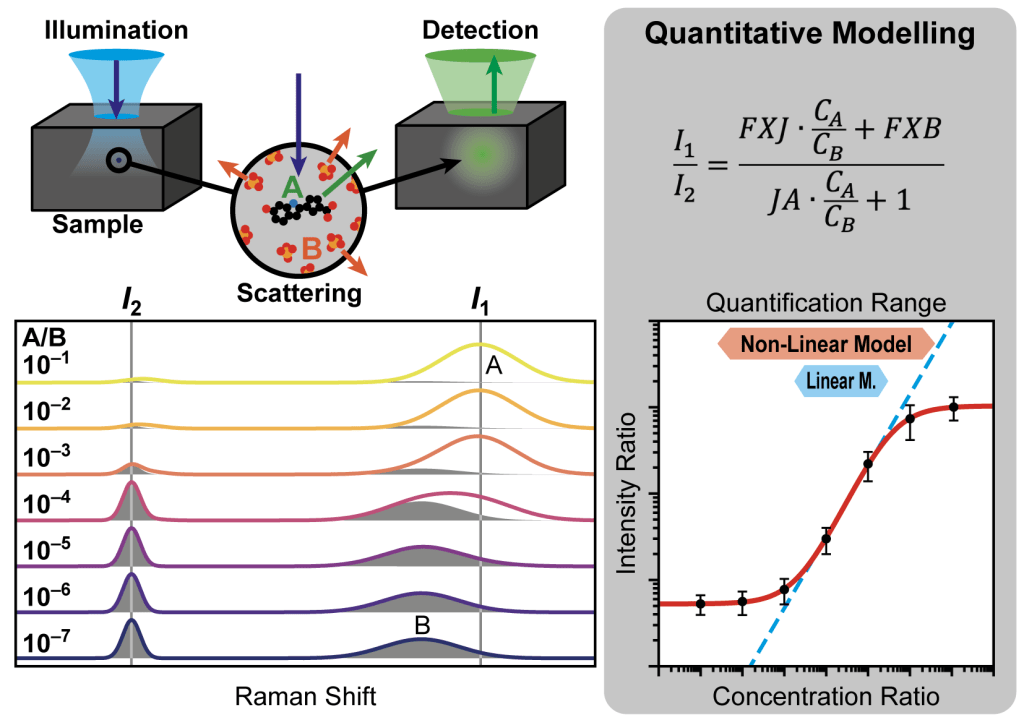
A Nonlinear Quantitative Model for Measuring Concentration Ratios From Raman Intensities
Joseph Razzell Hollis
Journal of Raman Spectroscopy, 2026
Abstract: Raman spectroscopy is a valuable tool for detecting trace compounds over wide ranges of concentrations but is usually limited to qualitative analysis (e.g., identification) due to the difficulty of determining concentration from Raman peak intensity except under very controlled conditions. This study presents a new quantitative model, derived from first principles, that can be used to estimate the concentration ratio of binary mixtures from their Raman intensities over several orders of magnitude, fully accounting for any nonlinear behaviors introduced by factors such as overlapping peaks and self-absorption. By training the model on experimental data of mixtures with known concentrations, the empirical parameters describing a particular mixture can be ascertained and then used to predict concentrations in further samples. The efficacy of the model is explored using synthetic datasets representing four scenarios depending on which compounds contribute to each peak. Bootstrapped model training can be used to consider the effects of noise, determine uncertainties for future predictions, and estimate the limits of detection and quantification for any given measurement. Finally, the model’s efficacy is tested on experimental data for aqueous solutions of different organic nucleotides at concentration ratios between 0.1 and 1000ppm, showing that the model works over 4 orders of magnitude and can be used to reliably predict the concentration ratio of test samples to within 0.1 orders of magnitude. This advanced model will improve our ability to estimate and assess concentrations in a wide range of mixed samples, even when their peaks overlap significantly.
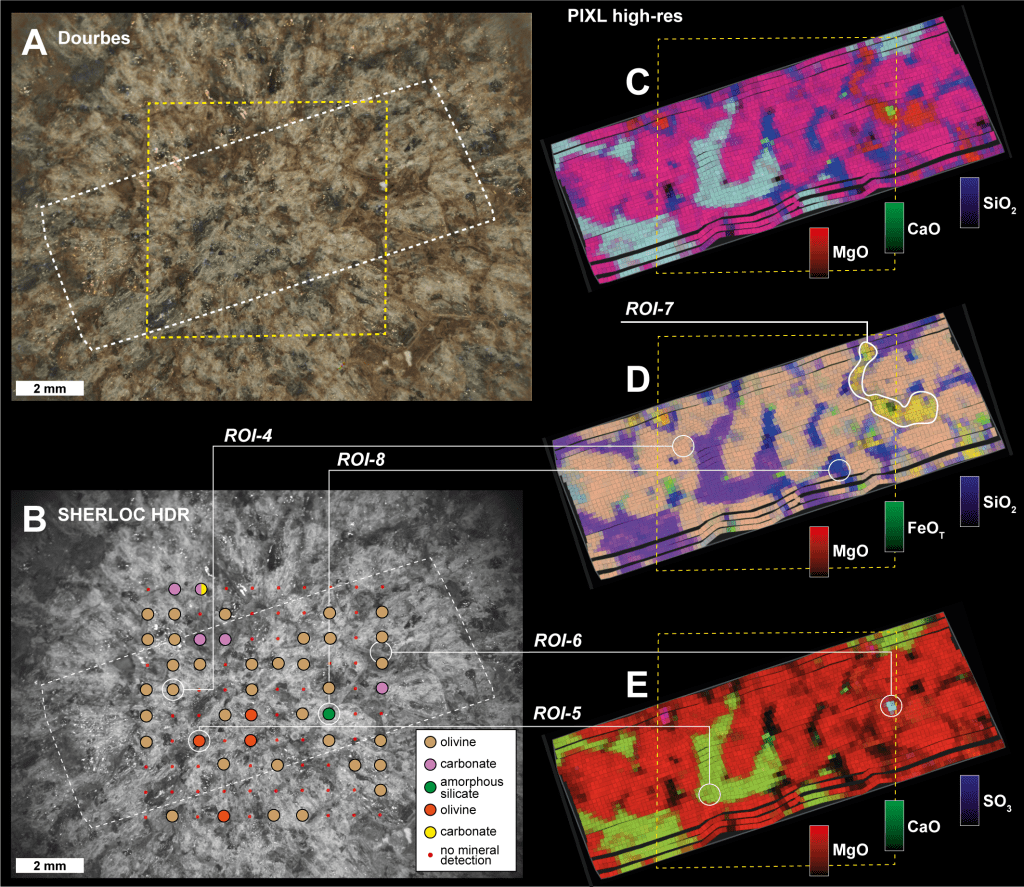
Mineralogical and Chemical Mapping of Martian Meteorite SaU 008 Using Deep UV Raman and Fluorescence Spectroscopy on Earth and Mars
Joseph Razzell Hollis, Kelsey Moore, Marc Fries, Cindy Broderick, Yannick Buret, Rohit Bhartia, Teresa Fornaro, Trevor Graff, Kevin P. Hand, Keyron Hickman-Lewis, Ryan Jakubek, Carina Lee, Francis M. McCubbin, Richard V. Morris, Ashley Murphy, Sunanda Sharma, Caroline Smith, Andrew Steele, Kyle Uckert
JGR: Planets, 2025
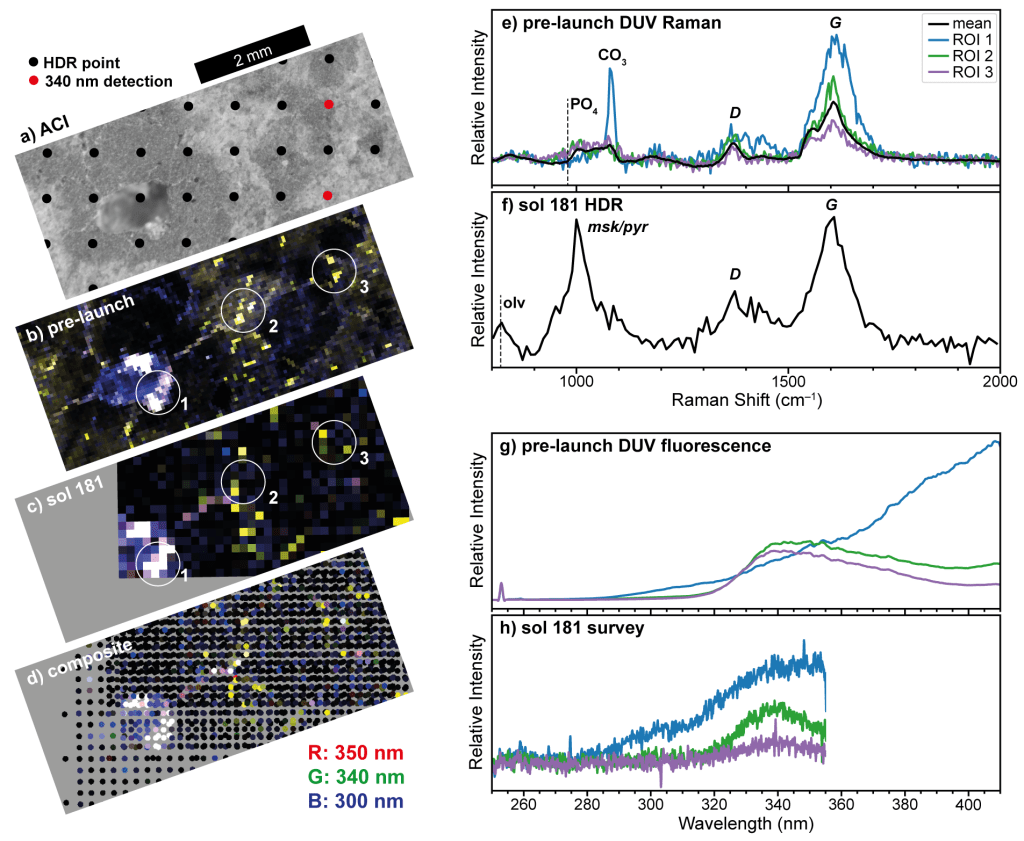
Abstract: The NASA Mars 2020 mission Perseverance rover carries a piece of Martian meteorite Sayh al Uhaymir (SaU) 008 as part of the calibration payload for the SHERLOC science instrument. We report SHERLOC observations of the SaU 008 flight piece over the first 1,000 sols of the mission and compare them to measurements done prior to launch, showing consistent detection of the same deep‐ultraviolet (DUV) Raman and fluorescence signatures in the same locations. Co‐located X‐ray fluorescence (XRF) and DUV mapping of a reference SaU 008 piece on Earth confirm that the meteorite is comprised of an igneous mineral matrix consistent with shergottite, rich in olivine, maskelynite, and Fe‐Mg pyroxenes detectable by SHERLOC. Terrestrial weathering features consist of fractures and vugs filled with Ca‐carbonate. Fluorescence mapping reveals two major signatures: (a) broad‐spectrum fluorescence present throughout the igneous matrix but strongest in weathering features, attributed to organic material, and (b) narrow‐band 340 nm fluorescence spatially associated with ∼48 ppm cerium in <100 μm Ca‐phosphate grains. Raman revealed organic material in both the igneous matrix and terrestrial carbonate in the form of macromolecular carbon (MMC) with defect and graphitic bands at ∼1,380 and ∼1,600 cm− 1 respectively. Raman band parameters suggest that MMC associated with terrestrial weathering is less thermally mature, most likely the result of chemical alteration after landing on Earth. This study serves as a demonstration of SHERLOC’s capabilities when supported by co‐located XRF data from PIXL and suggests that SHERLOC can detect Ce in phosphate minerals at concentrations as low as 4 ppm.
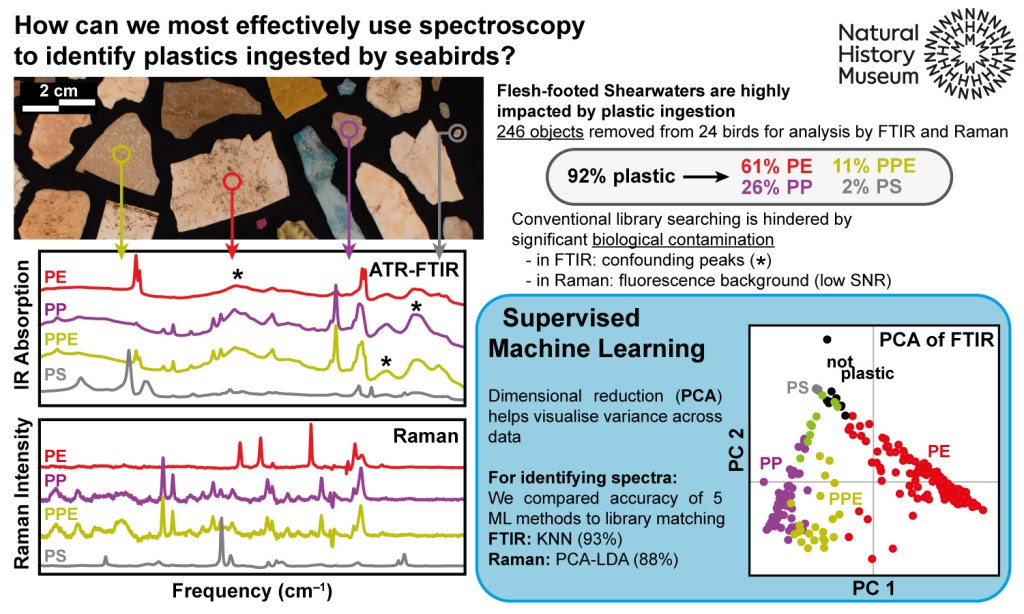
The Use of Vibrational Spectroscopy and Supervised Machine Learning for
Chemical Identification of Plastics ingested by Seabirds
Joseph Razzell Hollis, Jennifer L. Lavers, Alexander L. Bond
Journal of Hazardous Materials, 2024
Abstract: Plastic pollution is now ubiquitous in the environment and represents a growing threat to wildlife, who can mistake plastic for food and ingest it. Tackling this problem requires reliable, consistent methods for monitoring plastic pollution ingested by seabirds and other marine fauna, including methods for identifying different types of plastic. This study presents a robust method for the rapid, reliable chemical characterisation of ingested plastics in the 1–50 mm size range using infrared and Raman spectroscopy. We analysed 246 objects ingested by Flesh-footed Shearwaters (Ardenna carneipes) from Lord Howe Island, Australia, and compared the data yielded by each technique: 92 % of ingested objects visually identified as plastic were confirmed by spectroscopy, 98 % of those were low density polymers such as polyethylene, polypropylene, or their copolymers. Ingested plastics
exhibit significant spectral evidence of biological contamination compared to other reports, which hinders identification by conventional library searching. Machine learning can be used to identify ingested plastics by their vibrational spectra with up to 93 % accuracy. Overall, we find that infrared is the more effective technique for identifying ingested plastics in this size range, and that appropriately trained machine learning models can be
superior to conventional library searching methods for identifying plastics.

Quantitative Photography for Rapid, Reliable Measurement of Marine Macro-Plastic Pollution
Joseph Razzell Hollis, Gabrielle Henderson, Jennifer L. Lavers, Edward Rea, Valeriya Komyakova, Alexander L. Bond
Methods in Ecology & Evolution, 2024
Abstract: 1) Plastics are now ubiquitous in the environment and have been studied in wildlife and in ecosystems for more than 50 years. Measurement of size, shape, and colour data for individual fragments of plastic is labour-intensive, unreliable, and prone to observer bias, particularly when it comes to assessment of colour, which relies on arbitrary and inconsistently defined colour categorisations. There is a clear need for a standard method for data collection on plastic pollution, particularly one that can be readily automated given the number of samples involved. 2) This study describes a new method for standardised photography of marine plastics in the 1–100 mm size range (meso- and macro-plastics), including colour correction to account for any image-to-image variation in lighting that may impact colour reproduction or apparent brightness. Automated image analysis is then applied to detect individual fragments of plastic for quantitative measurement of size, shape, and colour. 3) The method was tested on 3793 fragments of debris ingested by Flesh-footed Shearwaters (Ardenna carneipes) on Lord Howe Island, Australia, and compare results from photos taken in two separate locations using different equipment. Photos were acquired of up to 250 fragments at a time with a spatial resolution of 70 μm/pixel and were colour-corrected using a reference chart to ensure accurate reproduction of colour. The automated image analysis pipeline was found to have a 98% success rate at detecting fragments, and the different size and shape parameters that can be outputted by the pipeline were compared in terms of usefulness. 4) The evidence shown in this study should strongly encourage the uptake of this method for cataloguing macro-scale plastic pollution, as it provides substantially higher quality data with accurate, reliable measurements of size, shape, and colour for individual plastics that can be readily compared between disparate datasets.
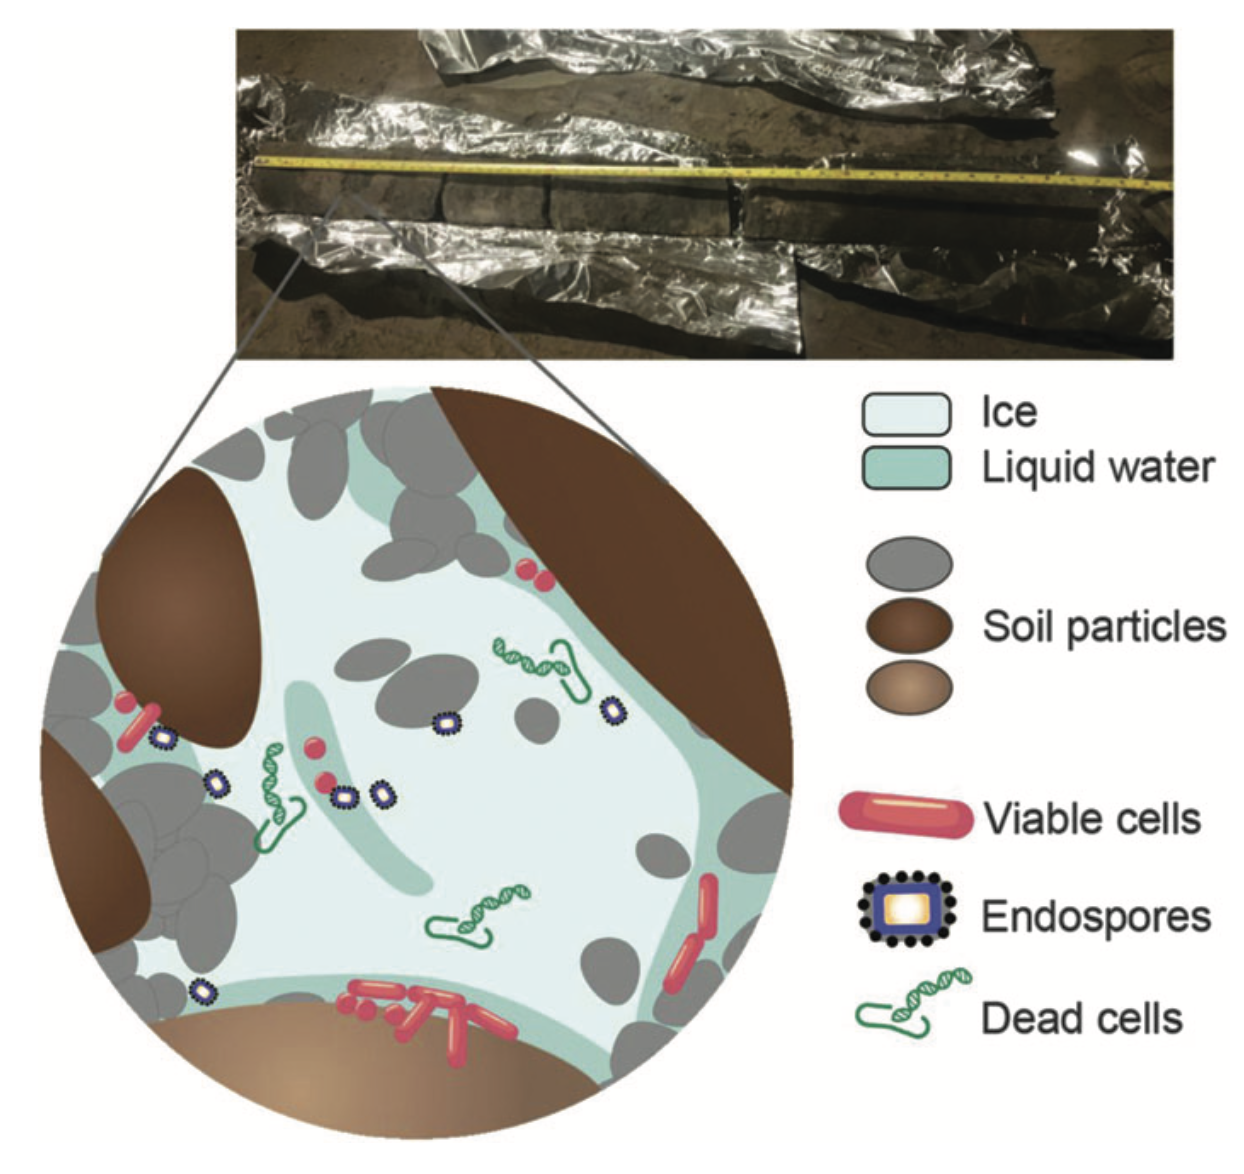
Earth to Mars: A Protocol for Characterizing Permafrost in the Context of Climate Change as an Analog for Extraplanetary Exploration
Kimberley R. Miner, Joseph Razzell Hollis, Charles E. Miller, Kyle Uckert, Thomas A. Douglas, Emily Cardarelli, and Rachel Mackelprang
Astrobiology, 2023, 23 (9):1006-1018
Abstract: Permafrost is important from an exobiology and climate change perspective. It serves as an analog for extra- planetary exploration, and it threatens to emit globally significant amounts of greenhouse gases as it thaws due to climate change. Viable microbes survive in Earth’s permafrost, slowly metabolizing and transforming organic matter through geologic time. Ancient permafrost microbial communities represent a crucial resource for gaining novel insights into survival strategies adopted by extremotolerant organisms in extraplanetary ana- logs. We present a proof-of-concept study on *22 Kya permafrost to determine the potential for coupling Raman and fluorescence biosignature detection technology from the NASA Mars Perseverance rover with microbial community characterization in frozen soils, which could be expanded to other Earth and off-Earth locations. Besides the well-known utility for biosignature detection and identification, our results indicate that spectral mapping of permafrost could be used to rapidly characterize organic carbon characteristics. Coupled with microbial community analyses, this method has the potential to enhance our understanding of carbon degradation and emissions in thawing permafrost. Further, spectroscopy can be accomplished in situ to mitigate sample transport challenges and in assessing and prioritizing frozen soils for further investigation. This method has broad-range applicability to understanding microbial communities and their associations with biosignatu- res and soil carbon and mineralogic characteristics relevant to climate science and astrobiology.

Diverse organic-mineral associations in Jezero crater, Mars
Sunanda Sharma, Ryan D. Roppel, Ashley E. Murphy, Luther W. Beegle, Rohit Bhartia, Andrew Steele, Joseph Razzell Hollis, et al.
Nature, 2023, 619:724-732
Abstract: The presence and distribution of preserved organic matter on the surface of Mars can provide key information about the Martian carbon cycle and the potential of the planet to host life throughout its history. Several types of organic molecules have been previously detected in Martian meteorites and at Gale crater, Mars. Evaluating the diversity and detectability of organic matter elsewhere on Mars is important for understanding the extent and diversity of Martian surface processes and the potential availability of carbon sources. Here we report the detection of Raman and fluorescence spectra consistent with several species of aromatic organic molecules in the Máaz and Séítah formations within the Crater Floor sequences of Jezero crater, Mars. We report specific fluorescence-mineral associations consistent with many classes of organic molecules occurring in different spatial patterns within these compositionally distinct formations, potentially indicating different fates of carbon across environments. Our findings suggest there may be a diversity of aromatic molecules prevalent on the Martian surface, and these materials persist despite exposure to surface conditions. These potential organic molecules are largely found within minerals linked to aqueous processes, indicating that these processes may have had a key role in organic synthesis, transport or preservation.
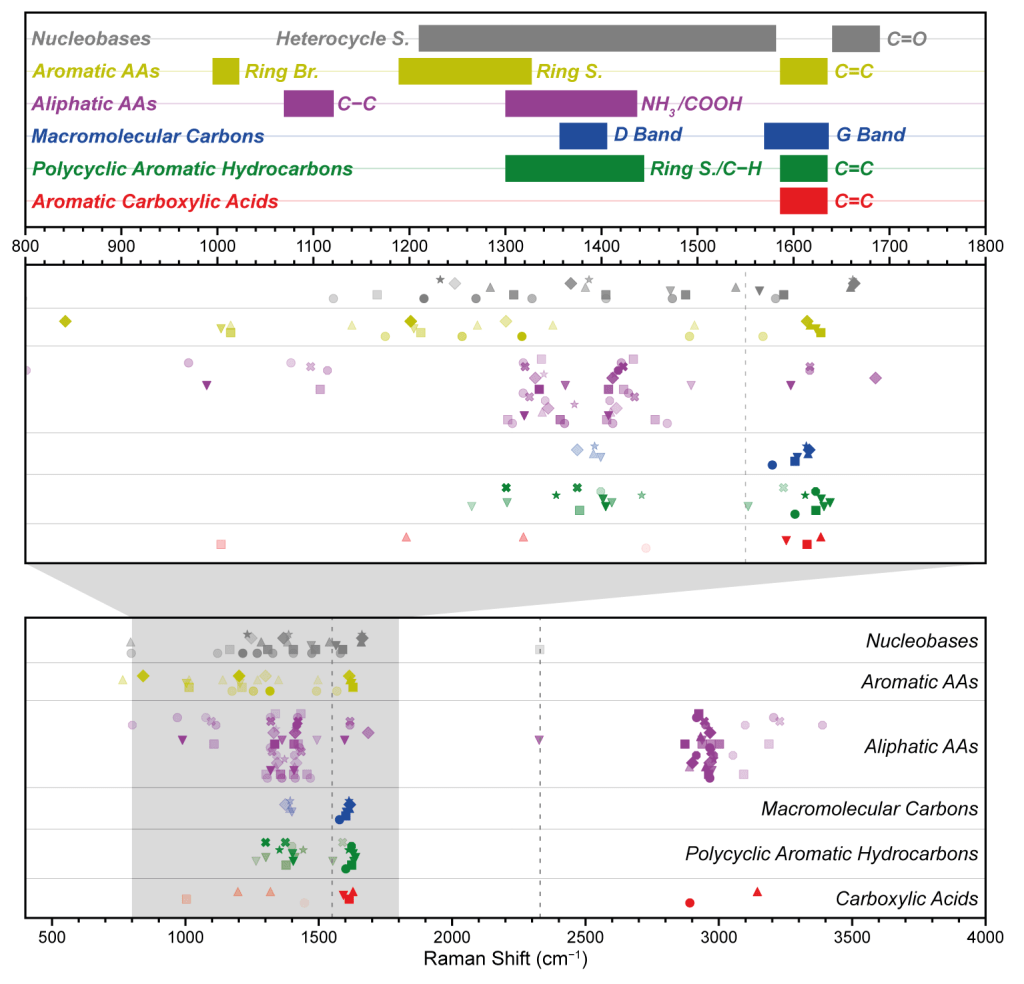
A Deep Ultraviolet Raman and Fluorescence Spectral Library of 51 Organic Compounds for the SHERLOC Instrument Onboard Mars 2020
Joseph Razzell Hollis, Sunanda Sharma, William Abbey, Rohit Bhartia, Luther Beegle, Marc Fries, et al.
Astrobiology, 2023, 23 (1):1-23
Abstract: We report deep ultraviolet (DUV) Raman and Fluorescence spectra obtained on a SHERLOC (Scanning Habitable Environments with Raman and Luminescence for Organics and Chemicals) analog instrument for 51 pure organic compounds, including 5 carboxylic acids, 10 polycyclic aromatic hydrocarbons, 24 amino acids, 6 nucleobases, and 6 different grades of macromolecular carbon from humic acid to graphite. Organic mixtures were not investigated. We discuss how the DUV fluorescence and Raman spectra exhibited by different organic compounds allow for detection, classification, and identification of organics by SHERLOC. We find that 1- and 2-ring aromatic compounds produce detectable fluorescence within SHERLOC’s spectral range (250–355 nm), but fluorescence spectra are not unique enough to enable easy identification of particular compounds. However, both aromatic and aliphatic compounds can be identified by their Raman spectra, with the number of Raman peaks and their positions being highly specific to chemical structure, within SHERLOC’s reported spectral uncertainty of –5 cm-1. For compounds that are not in the Library, classification is possible by comparing the general number and position of dominant Raman peaks with trends for different kinds of organic compounds.

Aqueous alteration processes in Jezero crater, Mars—implications for organic geochemistry
Eva L. Scheller & Joseph Razzell Hollis, Emily L Cardarelli et al.
Science, 2022, 378 (6624):1105-1110
Abstract: The Perseverance rover landed in Jezero crater, Mars, in February 2021. We used the Scanning Habitable Environments with Raman and Luminescence for Organics and Chemicals (SHERLOC) instrument to perform deep-ultraviolet Raman and fluorescence spectroscopy of three rocks within the crater. We identify evidence for two distinct ancient aqueous environments at different times. Reactions with liquid water formed carbonates in an olivine-rich igneous rock. A sulfate-perchlorate mixture is present in the rocks, which probably formed by later modifications of the rocks by brine. Fluorescence signatures consistent with aromatic organic compounds occur throughout these rocks and are preserved in minerals related to both aqueous environments.
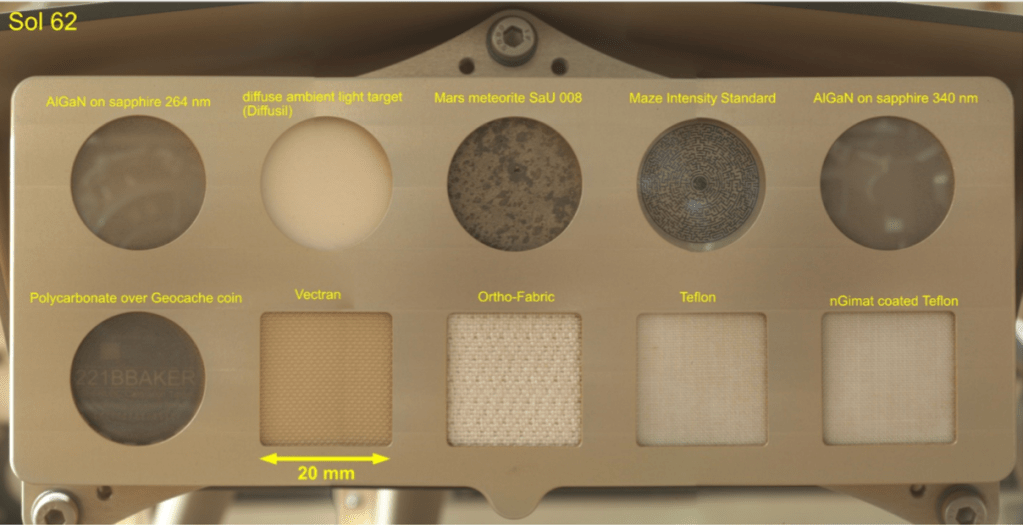
The SHERLOC Calibration Target on the Mars 2020 Perseverance Rover: Design, Operations, Outreach, and Future Human Exploration Functions
Marc D. Fries, Carina Lee, Rohit Bhartia, Joseph Razzell Hollis, Luther W. Beegle, Kyle Uckert, et al.
Space Science Reviews, 2022, 218:46
Abstract: The Scanning Habitable Environments with Raman and Luminescence for Organics and Chemicals (SHERLOC) is a robotic arm-mounted instrument onboard NASA’s Perseverance rover. SHERLOC combines imaging via two cameras with both Raman and fluorescence spectroscopy to investigate geological materials at the rover’s Jezero crater field site. SHERLOC requires in situ calibration to monitor the health and performance of the instrument. These calibration data are critically important to ensure the veracity of data interpretation, especially considering the extreme martian environmental conditions where the instrument operates. The SHERLOC Calibration Target (SCT) is located at the front of the rover and is exposed to the same atmospheric conditions as the instrument. The SCT includes 10 individual targets designed to meet all instrument calibration requirements. An additional calibration target is mounted inside the instrument’s dust cover. The targets include polymers, rock, synthetic material, and optical pattern targets. Their primary function is calibration of parameters within the SHERLOC instrument so that the data can be interpreted correctly. The SCT was also designed to take advantage of opportunities for supplemental science investigations and includes targets intended for public engagement. The exposure of materials to martian atmospheric conditions allows for opportunistic science on extravehicular suit (i.e. “spacesuit”) materials. These samples will be used in an extended study to produce direct measurements of the expected service lifetimes of these materials on the martian surface, thus helping NASA facilitate human exploration of the planet. Other targets include a martian meteorite and the first geocache target to reside on another planet, both of which increase the outreach and potential of the mission to foster interest in, and enthusiasm for, planetary exploration. During the first 200 sols (martian days) of operation on Mars, the SCT has been analyzed three times and has proven to be vital in the calibration of the instrument and in assisting the SHERLOC team with interpretation of in situ data.

In situ Identification of Paleoarchean Biosignatures Using Colocated Perseverance Rover Analyses: Perspectives for in situ Mars Science and Sample Return
Keyron Hickman-Lewis, Kelsey R. Moore, Joseph J. Razzell Hollis, Michael L. Tuite, Luther W. Beegle, Rohit Bhartia, John P. Grotzinger, Adrian J. Brown, Svetlana Shkolyar, Barbara Cavalazzi, and Caroline L. Smith
Astrobiology 2022, 22 (9) DOI:10.1089/ast.2022.0018
Abstract: The NASA Mars 2020 Perseverance rover is currently exploring Jezero crater, a Noachian–Hesperian locality that once hosted a delta–lake system with high habitability and biosignature preservation potential. Perseverance conducts detailed appraisals of rock targets using a synergistic payload capable of geological characterization from kilometer to micron scales. The highest-resolution textural and chemical information will be provided by correlated WATSON (imaging), SHERLOC (deep-UV Raman and fluorescence spectroscopy), and PIXL (X-ray lithochemistry) analyses, enabling the distributions of organic and mineral phases within rock targets to be comprehensively established. Herein, we analyze Paleoarchean microbial mats from the *3.42 Ga Buck Reef Chert (Barberton greenstone belt, South Africa) —considered astrobiological analogues for a putative ancient martian biosphere—following a WATSON–SHERLOC–PIXL protocol identical to that conducted by Perseverance on Mars during all sampling activities. Correlating deep-UV Raman and fluo- rescence spectroscopic mapping with X-ray elemental mapping, we show that the Perseverance payload has the capability to detect thermally and texturally mature organic materials of biogenic origin and can highlight organic–mineral interrelationships and elemental colocation at fine spatial scales. We also show that the Perseverance protocol obtains very similar results to high-performance laboratory imaging, Raman spectroscopy, and mXRF instruments. This is encouraging for the prospect of detecting microscale organic-bearing textural biosignatures on Mars using the correlative micro-analytical approach enabled by WATSON, SHERLOC, and PIXL; indeed, laminated, organic-bearing samples such as those studied herein are considered plausible analogues of biosignatures from a potential Noachian–Hesperian biosphere. Were similar materials discovered at Jezero crater, they would offer opportunities to reconstruct aspects of the early martian carbon cycle and search for potential fossilized traces of life in ancient paleoenvironments. Such samples should be prioritized for caching and eventual return to Earth.
The Power of Paired Proximity Science Observations: Co-Located Data from SHERLOC and PIXL on Mars
Joseph Razzell Hollis, Kelsey R. Moore,, Sunanda Sharma, Luther Beegle, John P. Grotzinger, Abigail Allwood, William Abbey, Rohit Bhartia, Adrian J. Brown, Benton Clark, Edward Cloutis, Andrea Corpolongo, Jesper Henneke, Keyron Hickman-Lewis, Joel A. Hurowitz, Michael W. M. Jones, Yang Liu, Jesús Martinez-Frías, Ashley Murphy, David A. K. Pedersen, Svetlana Shkolyar, Sandra Siljeström, Andrew Steele, Mike Tice, Alan Treiman, Kyle Uckert, Scott VanBommel, Anastasia Yanchilina
Icarus 2022, 387, 115179
Abstract: We present a synthesis of PIXL elemental data and SHERLOC Raman spectra collected on two targets investigated by the Perseverance rover during the first year of its exploration of Jezero Crater, Mars. The Bellegarde target (in the Máaz formation) and Dourbes target (in the Séítah formation) exhibit distinctive mineralogies that are an ideal case study for in situ analysis by SHERLOC and PIXL. Each instrument alone produces valuable data about the chemistry and spatial distribution of mineral phases at the sub-millimeter scale. However, combining data from both instruments provides a more robust interpretation that overcomes the limitations of either instrument, for example: 1) Detection of correlated calcium and sulfur in Bellegarde by PIXL is corroborated by the co-located detection of calcium sulfate by SHERLOC. 2) Detection of sodium and chlorine in Dourbes is consistent with either chloride or oxychlorine salts, but SHERLOC does not detect perchlorate or chlorate. 3) A Raman peak at 1120 cm–1 in Dourbes could be sulfate or pyroxene, but elemental abundances from PIXL at that location are a better match to pyroxene. This study emphasizes the importance of analyzing co-located data from both instruments together, to obtain a more complete picture of sub-millimeter-scale mineralogy measured in situ in Jezero crater, Mars, by the Perseverance rover.
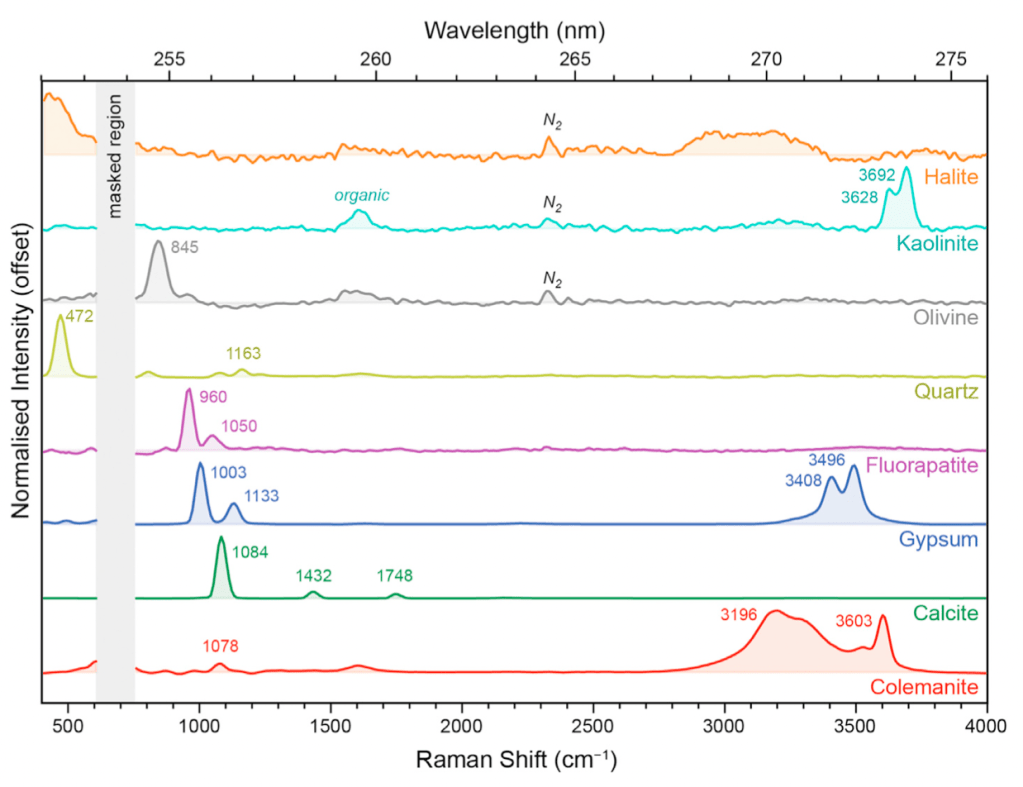
A Deep-Ultraviolet Raman and Fluorescence Spectral Library of 62 Minerals for the SHERLOC Instrument onboard Mars 2020
Joseph Razzell Hollis, William Abbey, Luther W. Beegle, Rohit Bhartia, Bethany L. Ehlmann, Jasper Miura, Brian Monacelli, Kelsey Moore, Austin Nordman, Eva Scheller, Kyle Uckert, Yen-Hung Wu
Planetary and Space Science, 209 (2022) 105356
Abstract: We report deep-ultraviolet (DUV) Raman spectra as measured by a SHERLOC analog instrument (248.6 nm excitation) for 92 samples representing 62 distinct minerals, including borates, carbonates, sulfates, phosphates, halides, metal oxides & hydroxides, silicates & phyllosilicates. We found that DUV Raman is capable of detecting the majority of these minerals, with major mineral peaks occurring at ~500, ~850, 950–1200, and ~3600 cm–1, and that detection thresholds will be better for the SHERLOC flight instrument than the analog used in this study. Minerals can be classified (e.g., sulfate vs carbonate, or pyroxene vs olivine) based on the number of major peaks and their general positions. Identification of specific mineral phases is possible based on precise Raman peak positions, provided the difference between spectrally similar minerals is at least 10 cm–1 to overcome the esti- mated instrumental uncertainty of 5 cm–1 for all peak positions reported in this study. A number of silicate minerals did not produce measurable Raman signal, and iron-rich minerals tend to be more difficult to detect due to significant UV absorption. Many Mars-relevant minerals expected to occur in Jezero crater should be detectable to SHERLOC even during short-exposure survey scans. This library will help inform the detection and identification of mineral phases in Martian samples using the SHERLOC instrument onboard the Mars 2020 Perseverance rover.

Detection and Degradation of Adenosine Monophosphate in Perchlorate-Spiked Martian Regolith Analogue, by Deep-Ultraviolet Raman Spectroscopy
Joseph Razzell Hollis, Teresa Fornaro, William Rapin, Jessica Wade, Álvaro Vicente-Retortillo, Andrew Steele, Rohit Bhartia, Luther W. Beegle
Astrobiology, 21 5 (2021) 511-525
Abstract: The search for organic biosignatures on Mars will depend on finding material protected from the destructive ambient radiation. Solar ultraviolet can induce photochemical degradation of organic compounds, but certain clays have been shown to preserve organic material. We examine how the SHERLOC instrument on the upcoming Mars 2020 mission will use deep-ultraviolet (UV) (248.6 nm) Raman and fluorescence spectroscopy to detect a plausible biosignature of adenosine 5′-monophosphate (AMP) adsorbed onto Ca-montmorillonite clay. We found that the spectral signature of AMP is not altered by adsorption in the clay matrix but does change with prolonged exposure to the UV laser over dosages equivalent to 0.2–6 sols of ambient martian UV. For pure AMP, UV exposure leads to breaking of the aromatic adenine unit, but in the presence of clay the degradation is limited to minor alteration with new Raman peaks and increased fluorescence consistent with formation of 2-hydroxyadenosine, while 1 wt % Mg perchlorate increases the rate of degradation. Our results confirm that clays are effective preservers of organic material and should be considered high-value targets, but that pristine biosignatures may be altered within 1 sol of martian UV exposure, with implications for Mars 2020 science operations and sample caching
Deep-Ultraviolet Raman Spectra of Mars-Relevant Evaporite Minerals under 248.6 nm Excitation
Joseph Razzell Hollis, Schelin Ireland, William Abbey, Rohit Bhartia, Luther W. Beegle
Icarus, 357 (2021) 114067
Abstract: We have measured the deep-ultraviolet (DUV) Raman spectra of a number of evaporite minerals that are relevant to lacustrine and fluvial environments found on Earth and Mars, and show that DUV Raman can provide detailed information on elemental composition and crystal structure. The minerals included three borates, eight carbonates, and seven sulfates, with each class of mineral exhibited very distinct spectra under 248.6 nm excitation, dominated by the various internal vibrations of the borate, carbonate or sulfate oxyanion. Major peak positions were similar to values reported under visible excitation: 1079 cm–1 for calcite, 1006 cm–1 for gypsum and 1078 cm–1 for colemanite. Within each class, minerals consisting different metallic cations could be distinguished by the position of the dominant vibrational mode and the relative intensities of the minor modes, ascribed to the electrostatic impact of the cation on the vibrational behavior of the oxyanion. There was also evidence that DUV Raman can reveal minor metallic components even if they are not apparent in XRD, as two of three calcite (CaCO3) samples exhibited a shoulder on the dominant peak consistent with perturbation by Mg. UV absorption by Fe2+/3+ was a major factor in determining measurable signal, with Fe-rich minerals exhibiting weak/undetectable spectra. Understanding the spectra of these evaporite minerals will be essential to interpreting and identifying complex mineral samples using this technique, and represents an important addition to the spectral standards library of DUV Raman spectroscopy

An Optical Model for Quantitative Raman Microspectroscopy
Joseph Razzell Hollis, David Rheingold, Rohit Bhartia, Luther W. Beegle
Applied Spectroscopy, 357 (2021) 114067
Abstract: Raman spectroscopy is an invaluable technique for identifying compounds by the unique pattern of their molecular vibrations, and is capable of quantifying the individual concentrations of those compounds provided that certain parameters about the sample and instrument are known. We demonstrate the development of an optical model to describe the intensity distribution of incident laser photons as they pass through the sample volume, determine the limitations of that volume that may be detected by the spectrometer optics, and account for light absorption by molecules within the sample, in order to predict the total Raman intensity that would be obtained from a given, uniform sample such as an aqueous solution. We show that the interplay between the shape and divergence of the laser beam, the position of the focal plane, and the dimensions of the spectrometer slit are essential to explaining experimentally observed trends in deep-UV (DUV) Raman intensities obtained from both planar and volumetric samples, including highly oriented pyrolytic graphite (HOPG) and binary mixtures of organic nucleotides. This model offers the capability to predict detection limits for organic compounds in different matrices based on the parameters of the spectrometer, and to define the upper/lower limits within which concentration can be reliably determined from Raman intensity for such samples. We discuss the potential to quantify more complex samples, including as solid phase mixtures of organics and minerals, that are investigated by the unique instrument parameters of the scanning habitable environments with Raman and luminescence for organics and chemicals (SHERLOC) investigation on the upcoming Mars 2020 mission.

The Cell and the Sum of Its Parts: Patterns of Complexity in Biosignatures as Revealed by Deep UV Raman Spectroscopy
Haley M. Sapers, Joseph Razzell Hollis, Rohit Bhartia, Luther W. Beegle, Victoria J. Orphan, Jan P. Amend
Frontiers in Microbiology, 10 (2019) 679
Abstract: The next NASA-led Mars mission (Mars 2020) will carry a suite of instrumentation dedicated to investigating Martian history and the in situ detection of potential biosignatures. SHERLOC, a deep UV Raman/Fluorescence spectrometer has the ability to detect and map the distribution of many organic compounds, including the aromatic molecules that are fundamental building blocks of life on Earth, at concentrations down to 1 ppm. The mere presence of organic compounds is not a biosignature: there is widespread distribution of reduced organic molecules in the Solar System. Life utilizes a select few of these molecules creating conspicuous enrichments of specific molecules that deviate from the distribution expected from purely abiotic processes. The detection of far from equilibrium concentrations of a specific subset of organic molecules, such as those uniquely enriched by biological processes, would comprise a universal biosignature independent of specific terrestrial biochemistry. The detectability and suitability of a small subset of organic molecules to adequately describe a living system is explored using the bacterium Escherichia coli as a model organism. The DUV Raman spectra of E. coli cells are dominated by the vibrational modes of the nucleobases adenine, guanine, cytosine, and thymine, and the aromatic amino acids tyrosine, tryptophan, and phenylalanine. We demonstrate that not only does the deep ultraviolet (DUV) Raman spectrum of E. coli reflect a distinct concentration of specific organic molecules, but that a sufficient molecular complexity is required to deconvolute the cellular spectrum. Furthermore, a linear combination of the DUV resonant compounds is insufficient to fully describe the cellular spectrum. The residual in the cellular spectrum indicates that DUV Raman spectroscopy enables differentiating between the presence of biomolecules and the complex uniquely biological organization and arrangements of these molecules in living systems. This study demonstrates the ability of DUV Raman spectroscopy to interrogate a complex biological system represented in a living cell, and differentiate between organic detection and a series of Raman features that derive from the molecular complexity inherent to life constituting a biosignature

Effects of Side-Chain Length and Shape on Polytellurophene Molecular Order and Blend Morphology
Joseph Razzell Hollis, Franziska Fleischli, Ashlee A. Jahnke, Natalie Stingelin, Dwight S. Seferos, Ji-Seon Kim
Journal of Physical Chemistry C, 121 (2017) 2088-2098
Abstract: We investigate the molecular order and thin film morphology of the conjugated polymer polytellurophene, in order to understand how the tellurium atom and the choice of side-chain influence the conjugated polymer’s backbone planarity and performance in organic transistors. We find that poly(3hexyltellurophene) (P3HTe) continues the trend from polythiophene (P3HT) to polyselenophene (P3HS): substitution with Tellurium leads to a more planar backbone, evident from the shifts of the C=C vibrational peak to lower wavenumbers (∼1389 cm–1) and a smaller optical band gap (∼1.4 eV). Resonant Raman spectroscopy revealed that molecular order was highly dependent on the structure of the P3ATe alkyl side-chain: a longer chains introduces kinetic hindrance, reducing the fraction of ordered phase obtained at room temperature, while a branched side-chain introduces steric hindrance, with intrinsic disorder present even when deposited at higher temperatures. When blended with the insulator HDPE, all three polymers exhibit little additional disorder and instead form phase-separated networks of high molecular order that are beneficial to percolated charge transport in transistors. We find that molecular order, as measured by Raman, correlates well with reported transistor mobilities and provides a greater understanding of the structure−property relationships that determine the performance of these novel organometallic polymers in electronic devices.
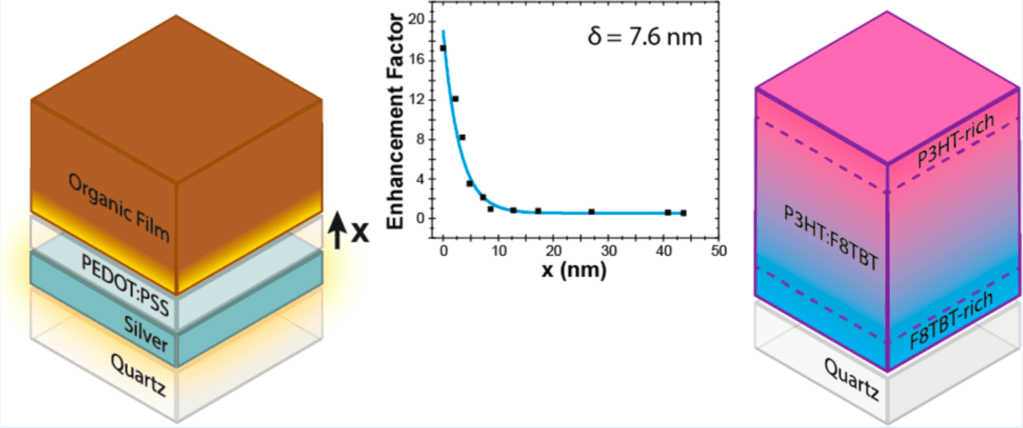
Interfacial Chemical Composition and Molecular Order in Organic Photovoltaic Blend Thin Films Probed by Surface-Enhanced Raman Spectroscopy
Joseph Razzell Hollis, Quentin Thiburce, Wing C. Tsoi, Ji-Seon Kim
ACS Applied Materials & Interfaces, 8 (2016) 31469-31481
Abstract: Organic electronic devices invariably involve transfer of charge carriers between the organic layer and at least one metal electrode, and they are sensitive to the local properties of the organic film at those interfaces. Here, we demonstrate a new approach for using an advanced technique called surface-enhanced Raman spectroscopy (SERS) to quantitatively probe interfacial properties relevant to charge injection/extraction. Exploiting the evanescent electric field generated by a ∼7 nm thick layer of evaporated silver, Raman scattering from nearby molecules is enhanced by factors of 10−1000× and limited by a distance dependence with a measured decay length of only 7.6 nm. When applied to the study of an all-polymer 1:1 blend of P3HT and F8TBT used in organic solar cells, we find that the as-cast film is morphologically suited to charge extraction in inverted devices, with a top (anode) interface very rich in hole-transporting P3HT (74.5%) and a bottom (cathode) interface slightly rich in electron-transporting F8TBT (55%). While conventional, uninverted P3HT:F8TBT devices are reported to perform poorly compared to inverted devices, their efficiency can be improved by thermal annealing but only after evaporation of a metallic top electrode. This is explained by changes in composition at the top interface: annealing prior to silver evaporation leads to a greater P3HT concentration at the top interface to 83.3%, exaggerating the original distribution that favored inverted devices, while postevaporation annealing increases the concentration of F8TBT at the top interface to 34.8%, aiding the extraction of electrons in a conventional device. By nondestructively probing buried interfaces, SERS is a powerful tool for understanding the performance of organic electronic devices.
.

Spectroscopic Investigations of Three-Phase Morphology Evolution in Polymer: Fullerene Solar Cell Blends
Joseph Razzell Hollis, Saurav Limbu, Ji-Seon Kim
Journal of Physical Chemistry C, 120 20 (2016) 10806-10814
Abstract: Nanoscale morphology is critical to determining the device efficiency of bulk heterojunction organic solar cells, and the ideal structure is often described as a three-phase network with one well-mixed phase for efficient charge separation and two purer phases for efficient charge transport. In order to understand such nanoscale morphology, we have performed detailed spectroscopic investigations and identified the three-phase morphology evolution in one of the classic blend systems, P3HT:PCBM. The impact of different phases on polymer molecular (chain conformational) order and blend thermal and optical properties were monitored in situ using resonant Raman, absorption, and photoluminescence spectroscopy techniques. Semicrystalline P3HT was found to accommodate up to ∼25% PCBM (by weight) in its amorphous phase, with very little impact on either polymer molecular order or aggregation. Higher concentrations of PCBM resulted in a greater proportion of amorphous mixed phase and reduced polymer molecular order and aggregation. On the other hand, the formation of crystalline purer phases via phase separation was evident during in situ thermal annealing, revealing a consistent glass transition temperature (Tg) of ∼50 °C in blends with up to 50% wt PCBM. This indicates similar local chemical compositions in the amorphous mixed phase present in blends despite different overall blend ratios. A much higher Tg (80−100 °C) was observed for blends with >50% wt PCBM, indicating a stronger impact of PCBM on P3HT molecular order and thermal properties, requiring a higher annealing temperature to ensure formation of the preferred three-phase morphology.
.

Photochemical stability of high efficiency PTB7:PC70BM solar cell blends
Joseph Razzell Hollis, Jessica Wade, Wing C. Tsoi, Ying Soon, James Durrant, Ji-Seon Kim
Journal of Materials Chemistry A, 2 (2014) 20189
Abstract: Thieno[3,4 b]thiophene-alt-benzodithiophene (PTB7) is a promising donor–acceptor copolymer that has achieved high efficiencies (7–9%) in organic solar cells but suffers from poor stability and degrades when exposed to light and oxygen. Using resonant Raman spectroscopy to examine the nature of this photo-oxidation, three main changes to the vibrations of the conjugated backbone are observed: (1) shift of the
benzodithiophene (BDT) C=C stretch peak at ~1489 cm–1 up to ~1499 cm–1; (2) increase in the relative intensity of coupled fused thiophene and benzene C=C stretch peaks at ~1535 and ~1575 cm–1; (3) appearance of a new peak at ~1650 cm–1; which suggest oxidation takes place on the BDT unit without loss of conjugation. In situ accelerated photo-degradation reveals that the observed oxidation is the initial step of degradation, which is followed by reductions in absorption and Raman scattering intensities that indicate the loss of chromophores by a second, more extensive oxidation step. Blending PTB7 with PC70BM is found to accelerate the polymer’s degradation, and further shift the BDT peak to ~1509 cm–1. Using density functional theory to simulate Raman spectra for several possible oxidised products, the initial oxidation is best described by hydroxylation of 3rd and 7th positions on the BDT donor unit.
.

Directly probing the molecular order of conjugated polymer in OPV blends induced by different film thicknesses, substrates and additives
Joseph Razzell Hollis, Wing C. Tsoi, Ji-Seon Kim
Journal of Materials Chemistry C, 1 (2013) 6235-6243
Abstract: In organic bulk heterojunction photovoltaic (OPV) devices, formation of a phase-separated morphology of the blend thin film with a high degree of molecular order is required for efficient device performance. Using resonant Raman spectroscopy we monitor in situ the P3HT molecular order in P3HT:PCBM blend films influenced by the substrate, film thickness and additives. We report that molecular order depends on substrate for as-cast films, consistent with vertical phase separation driven by a surface energy gradient, but is standardised to a highly ordered state by thermal annealing. In situ Raman spectroscopy reveals this phase transition to a more ordered state begins at 40–60 ºC for ~120 nm thick blend films, which corresponds to the glass transition temperature (Tg). Ultra-thin (<10 nm thick) blend films had greater P3HT order than the bulk and reorganised at lower temperatures, which we propose is due to a P3HT-rich interfacial layer at the film/air interface, and that extra disordered component retained despite annealing is due to P3HT trapped in a disordered state within the corresponding PCBM-rich substrate interface. Finally we probe how the 1,8-octanedithiol (ODT) additive improves P3HT molecular order in blends by increasing phase separation during deposition, finding that 3% ODT by volume presents a saturation point for improving molecular order, and the improvement is comparable to that by thermal annealing. Through in situ experiments and varied fabrication conditions, we have built an understanding of how processing conditions determine conjugated polymer molecular order in blends, with the aim of controlling morphology for higher OPV efficiencies.
